Dashboard
After you sign in, the portal lands on the Dashboard (/) — a single-page summary of the parts of your portfolio you can see — every project your team memberships give you access to.
The team control in the global bar records which team you are acting as — new projects are created under it — but it does not filter what you see. The Dashboard and the project list show everything your memberships reach, whichever team is selected. Scoping a view is something a screen asks for explicitly, through its own filters.
The page exists to answer the questions you typically arrive with, in the order you tend to ask them:
- What needs me right now? (action queue)
- Is the pile growing or shrinking? (risk over time)
- Who is carrying the risk? (portfolio by team)
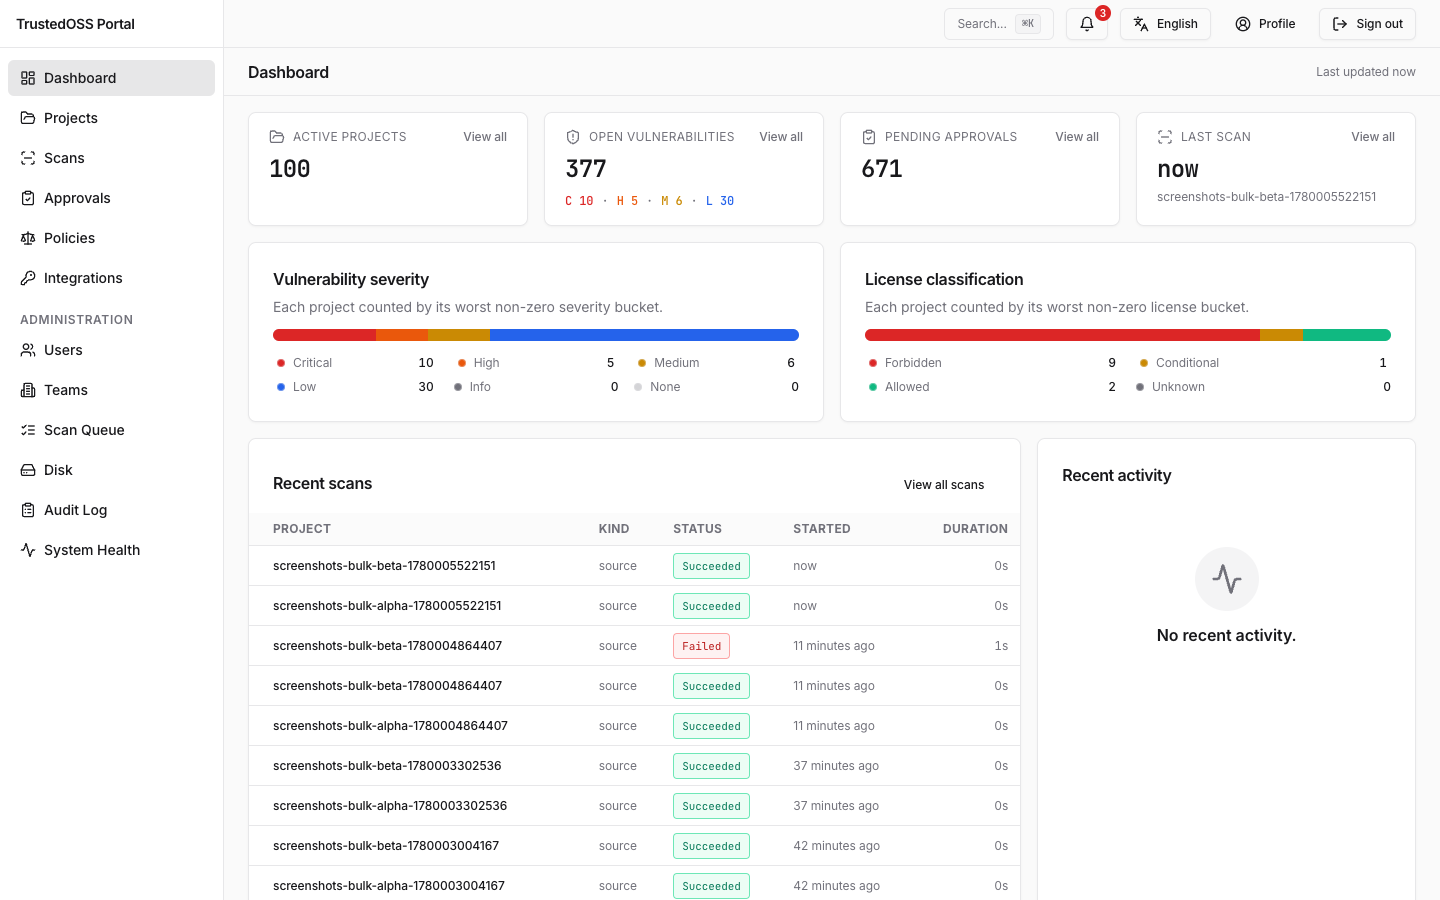
- Are there any new criticals, and is the license mix shifting? (severity tiles, license bar)
- What ran recently? (recent scans list)
Any signed-in user. The data scoping follows your team memberships — projects in teams you do not belong to do not contribute. Super-admins see every team's data.
What's on the page
The Dashboard renders these bands, stacked top-to-bottom. The first three are the ones a single-run scan report cannot produce: each needs an account, teams, and scan history that outlives the run that created it.
- Needs attention — the action queue. Approvals nobody has reviewed, known-exploited (KEV) findings measured against their CISA remediation date, projects the build gate is blocking, and projects with no successful scan in 14 days. Each tile links to the page that resolves it, and the blocked / stale projects are listed by name underneath. A tile tints only when its number means something is wrong; the count and the hint text carry the same state without the colour. If the queue fails to load, the panel says so rather than showing an empty queue — "nothing is waiting on you" and "we could not check" are different answers.
- Risk over time — three small charts over a 7-, 30-, or 90-day window. Open critical and Open KEV are levels: the standing exposure on each day, taken from each project's latest succeeded scan on or before it. New vs resolved is a flow: what each scan opened and closed compared with the previous scan of the same project, branch and scan kind. Levels carry forward on days nobody scanned, so a flat line can mean nothing changed or nobody looked — the panel says which by reporting how many scans landed. A scan with nothing before it to compare against contributes no flow at all, because scan retention deletes superseded snapshots and "no earlier scan on record" does not mean "nothing came before".
- Portfolio by team — every project you can see, grouped by the team that owns it, worst first. A cell is tinted by its worst severity bucket and prints that bucket's count; a project nobody has scanned is drawn differently from one that came back clean, because their numbers are identical and their meanings are not. The grid caps how many cells it shows per team and how many teams it shows, and says what it left out — open the project list for the rest.
- Vulnerabilities by severity — five tiles (Critical / High / Medium / Low / Info) with the open finding count across every project you can see. The count excludes findings whose VEX status is
Not affected,False positive,Fixed, orSuppressed— the same exclusions the build gate applies. - Portfolio — six tiles: project count, pending approvals, and four scan-status counts (Queued / Running / Succeeded / Failed) summed across the visible portfolio.
- License classification — a horizontal bar of the four tiers (Permissive / Conditional / Prohibited / Unknown) with a per-tier count legend below.
- Recent scans — the most recent scan rows across the portfolio, each linking to its project detail page. Every row carries the project name, the release tag (when a release snapshot was recorded for the run), the scan kind (
source/container), a status badge, and a relative timestamp.
The bands read four endpoints — /v1/dashboard/action-queue, /v1/dashboard/trends, /v1/dashboard/portfolio and /v1/dashboard/summary — each scoped server-side to the projects your team memberships reach. The page renders skeletons while the first responses are in flight. Subsequent reloads use the cached response and refetch in the background.
Global search (⌘K)
Press ⌘K (macOS) / Ctrl+K (Windows / Linux), or click the search box in the header, to open the command palette from anywhere in the app. It searches across every project you can access — scoped server-side to your teams, so results never include another team's data — in four groups:
- Projects — jump to a project by name.
- Pages — jump to a top-level page (Dashboard, Scans, Policies, …).
- Components — find a package by name or purl across your projects; selecting a hit opens that project's Components tab filtered to the term.
- CVEs — find a vulnerability by CVE id; selecting a hit opens that project's Vulnerabilities tab filtered to it.
The Components and CVEs groups query as you type (from two characters up, debounced); Projects and Pages match instantly. Everything is keyboard-navigable — arrow keys to move, Enter to open, Esc to close.
Empty state
A brand-new deployment with no projects shows a centered call-to-action ("No projects yet — register your first project to start scanning…") instead of zero-filled tiles. Click the Register project button to land on /projects/new.
Error state
If the dashboard endpoint returns a non-2xx response, the page replaces the tile area with a single inline error ("Couldn't load the dashboard. Please try again.") and a retry control. The recent-scans list and the rest of the navigation remain operable — the error is scoped to the summary widget.
Verify it worked
After signing in for the first time:
- The header avatar shows your initials and the sidebar highlights Dashboard.
- The severity tiles render five values (zero is fine).
- The recent-scans list either lists at least one row or shows the empty-state message ("No scans have run yet.").