Disk & system health
The portal exposes two operator dashboards under /admin:
- /admin/health — current state of every container service plus the Trivy DB freshness card (coming soon).
- /admin/disk — workspace and database storage usage with a configurable hard limit.
Together they let you catch problems before users notice.
super_admin operating the host. Familiarity with docker-compose ps and basic shell.
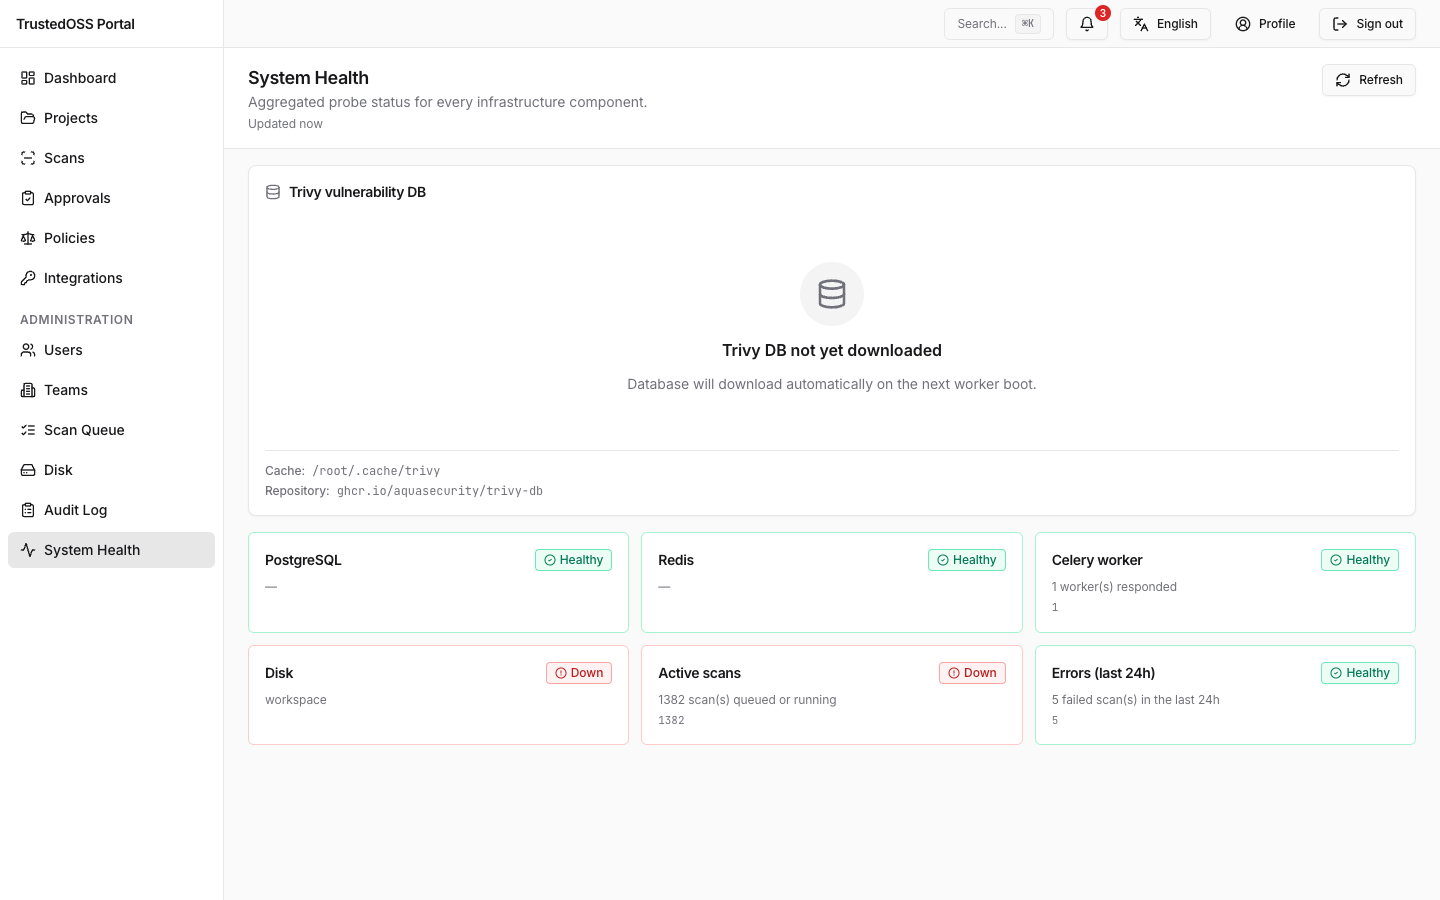
System health dashboard
The /admin/health page lists every component the portal depends on. Each row shows:
- Component — one of
postgres,redis,celery,disk,active_scans,last_24h_errors. Trivy DB freshness is shown in its own panel on the same page (see Vulnerability data). - State —
ok(green),degraded(yellow),down(red). The label rendered in the UI is locale-aware (the EN locale shows "OK / Degraded / Down"), but the API contract emits the lower-case enum above. - Detail — error message or telemetry summary when the state is not
ok.
All probes run synchronously when the page (or the API) requests them, so there is a single Last updated timestamp in the page header rather than a per-row "last check" — every card on the page reflects the same probe run.
The dashboard auto-refreshes via React Query polling (default 30 s; the user can pause polling from the page header). It is not a WebSocket stream — operators who want a wall display can leave the tab open and rely on the polling refresh.
Health probes
Each row maps to a real probe in services/admin_health_service.py:
| Component | Probe |
|---|---|
postgres | SELECT 1 over the application's asyncpg pool. |
redis | redis-cli ping-equivalent through the asyncio client. |
celery | Celery inspect ping returns within the configured timeout. |
disk | Workspace volume usage compared to the warn / critical thresholds. |
active_scans | Count of scans currently in running state — informational, surfaces to degraded when the queue length crosses an internal threshold. |
last_24h_errors | Count of ERROR-level structured-log events in the last 24 h — informational. |
The portal does not separately probe backend, worker, beat, frontend, or traefik. Their liveness is implicit: if the dashboard renders at all, the backend is up; if the celery row is ok, the worker (and the broker the worker depends on) are reachable.
endoflife.date snapshot panel
Below the Trivy DB and KEV feed panels, the endoflife.date snapshot panel tracks the dataset behind the Components tab's EOL badge:
- Snapshot date — the effective dataset's build date (the newer of the
release-vendored snapshot and, when
EOL_REFRESH_ENABLED=true, the last fetched one). The panel escalates to an amber Stale badge past 180 days — upgrade the release or rebuild the snapshot withpython3 scripts/refresh_eol_snapshot.py. - EOL-flagged components — live count of catalog component versions past their end-of-life.
- Recently stamped / cleared — what the weekly beat's re-stamp pass did on its last tick. The re-stamp runs even when the live fetch is off — it is a pure-local pass that applies a newer vendored snapshot to existing rows and clears stamps the whitelist no longer covers.
- Next tick — derived from the live Celery beat schedule (Sunday 02:15 UTC by default).
The footer shows the dataset origin (vendored vs fetched) and whether the
live refresh is on. The refresh is off by default — see
EOL_REFRESH_ENABLED in Environment variables.
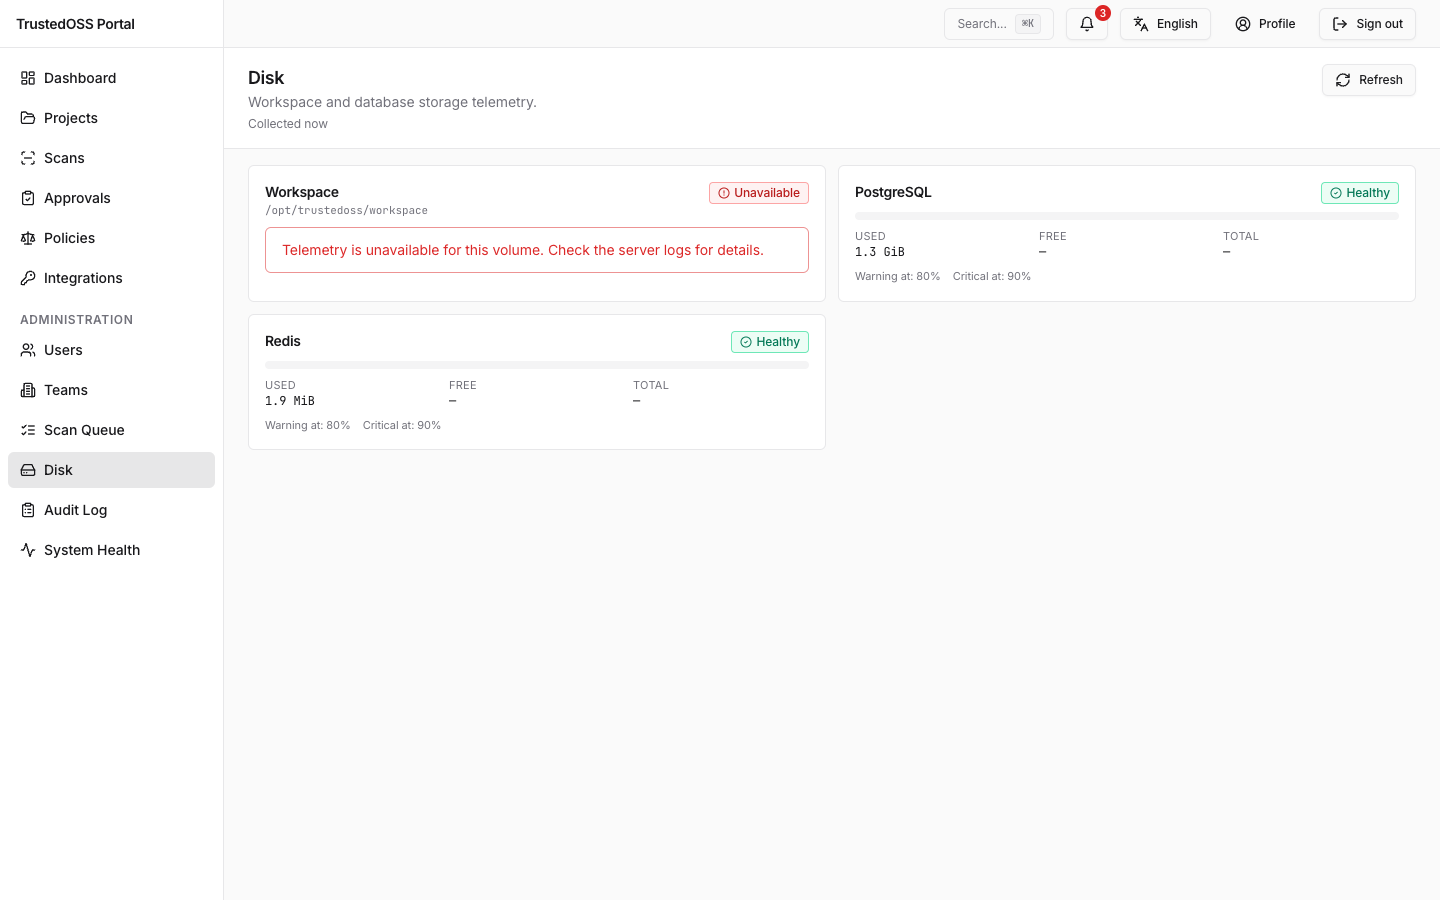
Disk dashboard
/admin/disk renders one card per filesystem the portal cares about. The actual cards from v0.10.0 are: workspace, trivy_db, postgres, redis (the API returns them as items: AdminDiskItem[] and the page renders one card per item). The earlier dt_volume card was removed when Dependency-Track was retired.
Each card has a warn threshold and a critical threshold:
| Threshold | Default | Effect |
|---|---|---|
| Warn | 80% | Yellow card, dashboard banner, no other side effect. |
| Critical | 90% | Red card, dashboard banner, an admin notification fires. |
Override in .env:
DISK_THRESHOLD_WARNING_PCT=80
DISK_THRESHOLD_CRITICAL_PCT=90
Separately, the scan disk-guard uses a single DISK_HARD_LIMIT_PCT (default 95) to block new scans when the workspace volume crosses that line. Cross-reference is intentional: the dashboard warns earlier (80% / 90%), the scan guard kicks in later (95%) to stop the bleed without surprising the operator.
DISK_HARD_LIMIT_PCT=95
What "scans blocked" means
When DISK_HARD_LIMIT_PCT trips, POST /v1/projects/{id}/scans returns:
{
  "type": "about:blank",
  "title": "Workspace Disk Full",
  "status": 503,
  "detail": "Workspace is at 96% (hard limit 95%). Free space and try again.",
  "instance": "/v1/projects/01H…/scans"
}
Existing in-flight scans are not killed; only new submissions are rejected. This avoids losing work but stops the bleed.
What to do when disk fills up
1. Identify the offender
The scan workspace lives at WORKSPACE_HOST_PATH. The production compose
(docker-compose.yml) sets it to /workspace inside the container; if you
overrode it in .env, substitute your path. Each scan creates a
${WORKSPACE_HOST_PATH}/<scan_id>/ directory.
docker-compose -f docker-compose.yml exec backend \
  du -sh "${WORKSPACE_HOST_PATH:-/workspace}"/*  | sort -h | tail -20
Most often a single scan's source clone (<scan_id>/source/) + scancode license-detection output (<scan_id>/scancode/scancode.json) dominates the workspace. The cdxgen cache (<scan_id>/cdxgen/) also grows over time.
2. Free space
# Drop scancode result JSON older than 30 days (safe — rebuilt on next scan).
docker-compose -f docker-compose.yml exec backend \
  find "${WORKSPACE_HOST_PATH:-/workspace}" -name "scancode.json" -mtime +30 -delete

# Drop cdxgen SBOM caches older than 30 days (safe — rebuilt on next scan).
docker-compose -f docker-compose.yml exec backend \
  find "${WORKSPACE_HOST_PATH:-/workspace}" -type d -name "cdxgen" -mtime +30 -exec rm -rf {} +

# Drop the entire workspace directory for one finished scan.
docker-compose -f docker-compose.yml exec backend \
  rm -rf "${WORKSPACE_HOST_PATH:-/workspace}/<scan-id>/"
3. Verify
After cleanup, /admin/disk updates within ~10 seconds. Once below the hard threshold, scans are accepted again automatically — no service restart needed.
4. Long-term remediation
- Move
WORKSPACE_HOST_PATHto a larger volume (edit.env, restartbackend,worker). - Lower
BACKUP_RETENTION_DAYSif local backups are eating space. - Move backups off-host (S3, NFS) and skip local pruning.
Notification triggers
Disk pressure does not generate a notification today; operators are expected to monitor /admin/disk directly. A disk_pressure notification kind is on the roadmap.
/admin/scans — Scan queue and worker monitoring
The /admin/scans page (super-admin only) lists every running, queued, succeeded, and failed scan across the org. Operators can:
- Inspect any task's full progress payload + last log frame.
- Force-cancel a stuck scan (
POST /v1/admin/scans/{scan_id}/cancel). - Filter by status, kind, or project name. (There is no per-worker filter — scans do not record which worker picked them up.)
Backend: apps/backend/api/v1/admin/scans.py. UI: apps/frontend/src/features/admin/scans/AdminScansPage.tsx.
Verify it worked
After making changes:
- /admin/health is all green.
- /admin/disk is below the warn line.
- A test scan against any project succeeds end-to-end.
Troubleshooting
docker-compose logs --tail=200 backend | grep disk_threshold— the threshold check task's last verdict./admin/diskAPI — per-card breakdown JSON (workspace, trivy_db, postgres, redis).- Host:
df -h /opt/trustedoss && docker system df.
Health page says everything is healthy but users complain
The dashboard is a snapshot of liveness, not full functionality. Liveness can pass while:
- The worker has accepted tasks but is hung on a sub-process (very rare). Restart the worker.
- The Trivy DB is on disk but has not been refreshed in a long time — see Vulnerability data — Troubleshooting for the weekly-refresh check.
Disk gauge is wrong
The gauge reads the host-mounted volume from inside the backend container. If you changed WORKSPACE_HOST_PATH recently and forgot to restart, the gauge points at the old volume. Restart the backend.
Hard limit is too aggressive
Raise it. 95% is a conservative default for DISK_HARD_LIMIT_PCT that gives operators room to react before the host runs out. If your monitoring catches issues earlier, you can lower it. Routinely operating above the warn threshold (80%) is a sign you should add disk.
Roadmap
The following affordances are referenced in early docs but are not shipped in this release:
- Per-component liveness probes for
backend,worker,beat,frontend, andtraefikon the health dashboard (today these are inferred from the dashboard rendering and theceleryrow). - WebSocket-streamed health updates (today the dashboard uses React Query polling).
- Multi-shot consecutive-miss state machine for components beyond the
vulnerability_datarow planned.