Scans
A scan is one end-to-end run that detects components, licenses, and vulnerabilities for a project. Scans run on a Celery worker (never inline on the API) — typical durations range from 5 minutes (small npm projects) to 60 minutes (large multi-module Java repositories).
Engineers with developer or higher on the project's team. Triggering scans against private repos requires repo credentials embedded in the project's git_url — see Projects → Private repositories.
Scan kinds
| Kind | Pipeline | What it detects |
|---|---|---|
source | cdxgen (CycloneDX generator) → scancode (first-party license detection) → Trivy (trivy sbom) | Components and their declared licenses (from dependency metadata) plus detected licenses (scancode reading your own first-party source), and CVEs (Common Vulnerabilities and Exposures) matched by the local Trivy DB against NVD + OSV + GHSA + EPSS + KEV. |
container | Trivy (Aqua Security container scanner) | OS-package vulnerabilities and (limited) language-package CVEs in a container image. |
sbom | conformance scoring → component persistence → Trivy (trivy sbom) | An SBOM your own tooling already produced (CycloneDX-JSON or SPDX). TRUSCA does not clone or build your source — it scores the SBOM's quality, persists its components, and matches CVEs. See SBOM upload below. |
Source and Container are selectable from the UI scan dialog — pick one when you trigger a scan (see Trigger a scan → From the UI). An sbom scan is created differently: you upload an existing SBOM to the ingest endpoint rather than picking it in the dialog (see SBOM upload). The API accepts all three kinds.
Trigger a scan
From the UI
- Open Projects in the sidebar.
- Find the project row and click the Scan button at the end of the row.
- The scan dialog opens. At the top, choose the scan type:
- Source — runs cdxgen + scancode + Trivy on the project's source. This is the default.
- Container — runs Trivy on a container image you name. See Scan a container image.
- For a Source scan, pick how to provide the source (Git URL, an uploaded
.zip, or a folder zipped in the browser), then click Start scan.
The scan dialog has a Verbose logs (debug) toggle (off by default). Leave it off for the standard progress trace. Turn it on for a single scan to stream the full cdxgen / scancode / Trivy diagnostic output into the per-stage log panel — cdxgen runs in debug mode, scancode emits a per-file line, and Trivy switches to --debug. Use it when you are debugging why a scan found too few components, missed a license, or matched an unexpected CVE. Verbose output can be large; the per-scan line budget (SCAN_LOG_MAX_LINES_PER_SCAN, default 20000) still caps it. Credentials are redacted from the log on the way out, and a verbose source scan additionally lists each scanned file's path — visible to anyone on the team who can open the scan, so prefer it on internal/trusted projects when sharing logs widely. Over the API, set metadata.verbosity to "verbose" (absent or "normal" keeps the quiet trace).
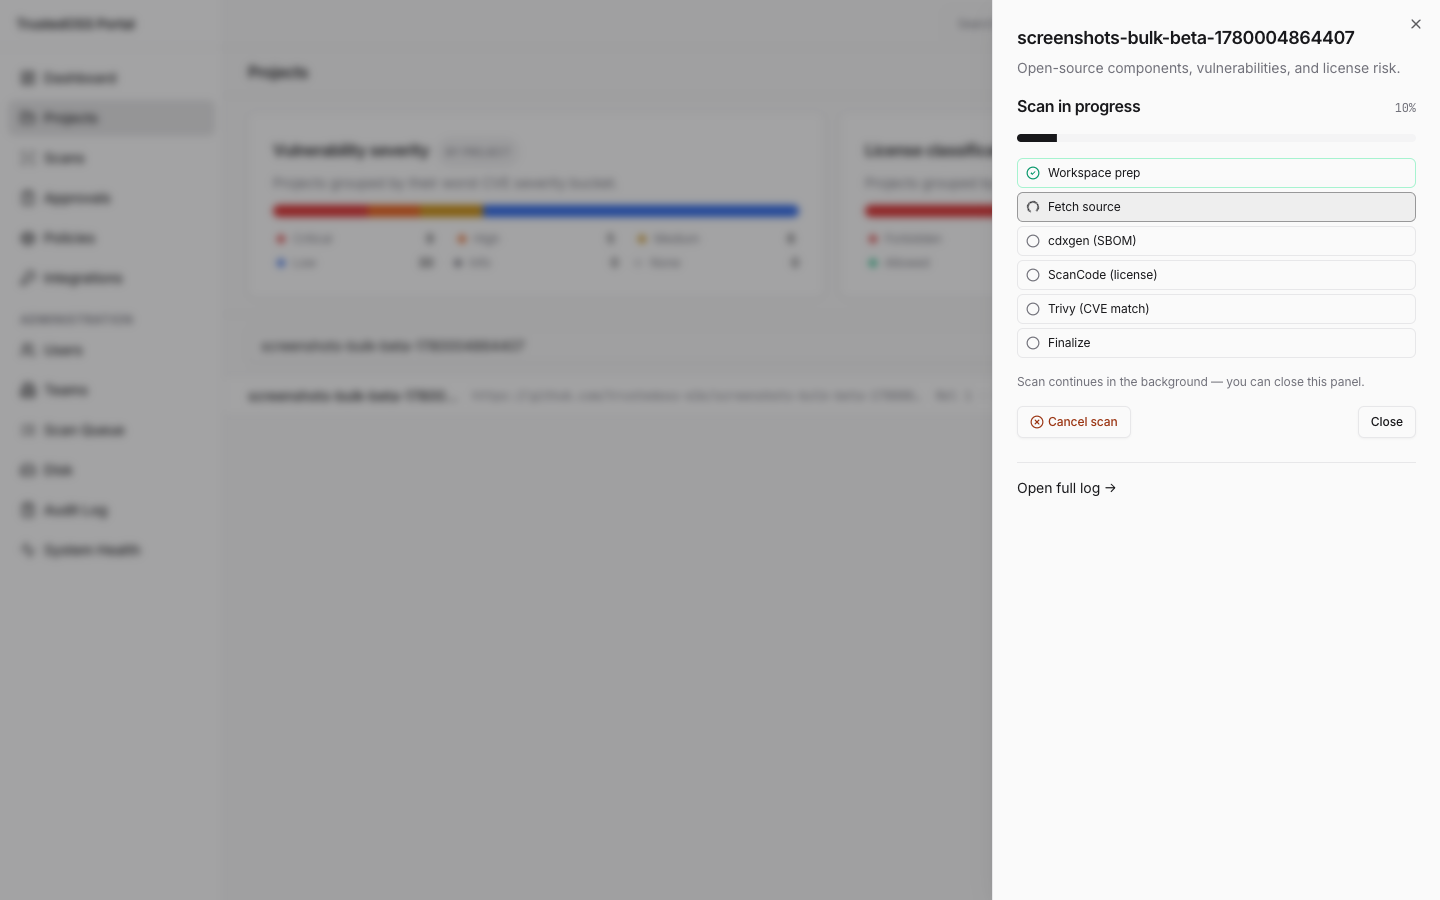
A right-slide drawer opens on the project list page with a live progress view backed by a WebSocket connection. You can close the tab — the scan continues on the worker. Reopen the project and reconnect at any time. While a scan is queued or running, the drawer carries a Cancel scan action — see Cancel a scan.
If a project already has a queued or running scan, the Scan button is disabled on the project detail header and its tooltip points you at the in-progress chip in the header (clicking the chip re-opens the existing scan's progress drawer). Triggering a second scan via the API returns 409 Conflict with the RFC 7807 extension scan_already_in_progress: true — wait for the active scan to reach a terminal state, or Cancel it, before starting another. The same guard applies to UI, API, and CI clients.
Source scans run against the project's default_branch (typically
main). Neither the UI nor the API exposes a branch override in this
release. To scan develop or a feature branch, temporarily change
default_branch in Project Settings before triggering the scan,
then revert. A first-class branch field on the trigger is on the
roadmap.
Scan a container image
Pick Container in the scan dialog to scan a built image instead of source. Trivy (the Aqua Security container scanner) inspects the image's OS packages for known vulnerabilities — complementary to a source scan, which covers your application's dependency tree.
- Open the scan dialog from the project row's Scan button.
- At the top of the dialog, select Container.
- Enter the container image reference in
name:tagform, for examplealpine:3.19orghcr.io/org/app:1.2.3. The image must be pullable from the worker (public registries, or a registry the worker is authenticated against). - Click Start scan.
The same progress drawer opens. When the scan reaches succeeded, the OS-package vulnerabilities appear under the project's Vulnerabilities tab.
Base-image OS end-of-life
Trivy also reports whether the image's base OS release is past its end-of-service-life — a release such as an old Debian or Alpine version that no longer receives upstream security fixes. When it is, the scan detail page shows an OS end-of-life panel naming the OS family and release. This is a scan-level signal distinct from the per-component end-of-life badge on source scans: even if no individual package CVE fires, an image built on an end-of-life OS will never receive patches for CVEs disclosed after that OS retired, so the recommendation is to rebuild on a supported release.
The end-of-life verdict comes from Trivy's bundled vulnerability database, so it needs no extra network access. A stale database may not yet flag a release that was retired very recently; keep the Trivy database fresh (see the admin health panel) for an accurate verdict.
A container scan reads an image reference, not the repository. A project with no git_url can still run container scans. The Source / Container choice is independent of the project's source configuration.
From the API
curl -sS -X POST \
  "https://trustedoss.example.com/v1/projects/${PROJECT_ID}/scans" \
  -H "Authorization: Bearer ${TRUSTEDOSS_API_KEY}" \
  -H "Content-Type: application/json" \
  -d '{"kind": "source"}' | jq .
The response carries the scan UUID. Poll:
curl -sS "https://trustedoss.example.com/v1/scans/${SCAN_ID}" \
  -H "Authorization: Bearer ${TRUSTEDOSS_API_KEY}" | jq .status
For a container scan, set kind to container and pass the image reference under metadata.image_ref:
curl -sS -X POST \
  "https://trustedoss.example.com/v1/projects/${PROJECT_ID}/scans" \
  -H "Authorization: Bearer ${TRUSTEDOSS_API_KEY}" \
  -H "Content-Type: application/json" \
  -d '{"kind": "container", "metadata": {"image_ref": "alpine:3.19"}}' | jq .
From CI
The recommended path is the GitHub Action, the GitLab CI template, or the Jenkinsfile example. Each one wraps the API and adds the build gate.
SBOM upload (received SBOMs)
If your own build or CI already produces an SBOM, you can upload it instead of having TRUSCA clone and scan your source. This creates an sbom scan: TRUSCA persists the SBOM's components, matches CVEs with Trivy, and classifies declared licenses — the same component / vulnerability / license views you get from a source scan, and the build gate runs on it too.
- Formats: CycloneDX-JSON, or SPDX (JSON or Tag-Value). Trivy auto-detects the format for matching; SPDX is mapped to CycloneDX internally for the component graph.
- How to upload:
POST /v1/projects/{project_id}/sbom-ingestwith an API key. The full how-to (fields, size limits, errors) is in Upload an SBOM.
Conformance verdict
Because a supplier-provided SBOM can be a "shell" with missing versions, PURLs, or no dependency graph, TRUSCA scores its quality on ingest and shows a pass / warn / fail badge plus a per-requirement table on the scan detail page. The verdict is advisory — a fail does not block ingest (CVE matching still runs); it tells you whether to accept the SBOM or send it back to the supplier. Mandatory checks include a timestamp, tool info, a top-level component, 100% component name+version, PURL coverage ≥ 90%, no pkg:generic placeholders, and a transitive dependency graph; license and hash coverage are recommended (warn-only). Read it via the UI panel or GET /v1/projects/{project_id}/scans/{scan_id}/conformance — see Upload an SBOM → Read the conformance verdict.
On CycloneDX documents the verdict also carries five regulatory field checks — SHA-512 checksum, component creator, component filename, source / distribution URI, and delivered-file properties coverage (threshold SBOM_CONFORMANCE_FIELD_MIN_PCT, default 80). They are advisory and verdict-neutral: they never move the pass / warn / fail badge. Instead they feed a regulatory crosswalk that cross-references each check to the documentation requirements of four frameworks — BSI TR-03183-2 (EU Cyber Resilience Act), the US NTIA minimum elements, EU AI Act Annex IV, and Korea's AI Framework Act — and rolls them up per framework as present / gap / needs human review. The crosswalk is a documentation-preparation aid, not a compliance determination, and the response carries that disclaimer verbatim. See Upload an SBOM → Regulatory field checks.
CycloneDX specVersion 1.7 is accepted, and when the uploaded document carries a machine-learning-model component the panel appends the advisory G7 AI SBOM minimum elements checklist (51 elements in seven clusters) — see AI SBOM conformance.
Lifecycle
queued ─────► running ─────► succeeded
   │                  │
   │                  └────► failed
   │                  │
   └──────────────────┴────► cancelled
| Status | Meaning |
|---|---|
queued | Enqueued; waiting for a free worker slot. |
running | A worker has picked up the task and is executing the pipeline. |
succeeded | Pipeline finished, components and findings are now queryable. |
failed | The worker raised an error. Inspect error_detail in the API response or the worker log. |
cancelled | A user or admin cancelled the run while it was queued or running. The worker task was stopped and its workspace reclaimed. See Cancel a scan. |
queued, running are non-terminal; succeeded, failed, and cancelled are terminal. A scan can be cancelled only from a non-terminal state.
Pipeline stages (source)
The progress view shows real-time stage transitions:
- Bootstrapping — preparing the workspace.
- Fetching source —
git clone(orgit fetch+ checkout for an existing workspace). - Detecting components —
cdxgenwalks the repo and emits a CycloneDX SBOM, with declared licenses read from each dependency's package metadata. Immediately after, the runtime-scope post-filter drops non-deployable dependencies (Maventest/provided, npmdevDependencies) so every later stage — signing, persistence, vulnerability matching — sees the deployable set; see Components & licenses → Runtime-scope filtering. - Detecting first-party licenses — scancode scans the project's own source files and records the detected licenses it finds, each tagged with the
source_pathof the file it came from (see Components & licenses → Detected vs. declared). This stage is best-effort: if scancode is not installed, times out, or the tree is too large, the scan continues with declared licenses only — a degraded but non-fatal outcome. Legal-tier classification is then applied from the built-in classifier catalog (see Components & licenses → Classification source). - Resolving vulnerabilities —
trivy sbommatches the CycloneDX SBOM against the local Trivy DB (NVD + OSV + GHSA + EPSS + KEV). No network call per scan. - Persisting — components, licenses, and findings are written to PostgreSQL.
Earlier builds ran the OSS Review Toolkit (ORT) at the license stage. v0.10.0 replaces it with scancode for first-party detection. Third-party dependency sources are deliberately not downloaded — that kept per-scan runtime within budget — so dependency licenses stay declared (from cdxgen) and scancode adds detected licenses for the code your team actually wrote.
If the local Trivy DB has not finished downloading when stage 5 runs (most common on a fresh install), the scan completes with 0 vulnerability findings and a banner on the Vulnerabilities tab pointing operators at Vulnerability data (Trivy DB). The automatic re-match beat picks up findings once the DB lands — no re-scan needed.
iOS projects (CocoaPods / Swift Package Manager)
iOS repositories scan offline from their committed lockfiles — the worker needs neither Xcode, a Swift toolchain, nor the CocoaPods CLI:
- CocoaPods —
cdxgencannot catalog pods without thepodCLI, so the scanner excludes that cataloger (avoiding a crash that used to kill the whole scan) and reconstructs the pod set and its dependency graph directly fromPodfile.lock. ThePODS:block is the fully resolved truth: direct and transitive pods, pinned versions, and each pod's sub-dependencies — subspecs likeMoya/Coreappear as their own components. Pods carry no Usage (Required/Optional) value becausePodfile.lockrecords no runtime/test distinction; the column shows—. - Swift Package Manager — a committed
Package.resolvedis parsed bycdxgenas-is (both the v1 and v2 formats). The sidecar executors skipswift package resolvewhen the file is committed — the committed lockfile already is the resolved graph, and re-resolving would hit the network.
Commit Podfile.lock and Package.resolved to the repository — without
them an iOS scan finds only what the manifests declare.
Average duration
| Project size | Source scan | Container scan |
|---|---|---|
| Small (≤ 50 components) | 3–8 min | 1–3 min |
| Medium (50–500) | 8–20 min | 2–5 min |
| Large (≥ 500, multi-module) | 20–60 min | 5–10 min |
The dominant cost in a source scan is the cdxgen walk, with scancode adding time proportional to the size of the first-party tree. The trivy sbom matching stage is fast — the Trivy DB is local and per-scan I/O is well under a second per thousand components. Container scans are bound by image-pull time when the image is not in the worker's cache.
The global scan queue
Visit Scans in the left sidebar for an organization-wide view of every running and queued scan. The queue is split into 5 status tabs: Running, Queued, Succeeded, Failed, All. Project- / team-level filters and per-worker views are on the roadmap.
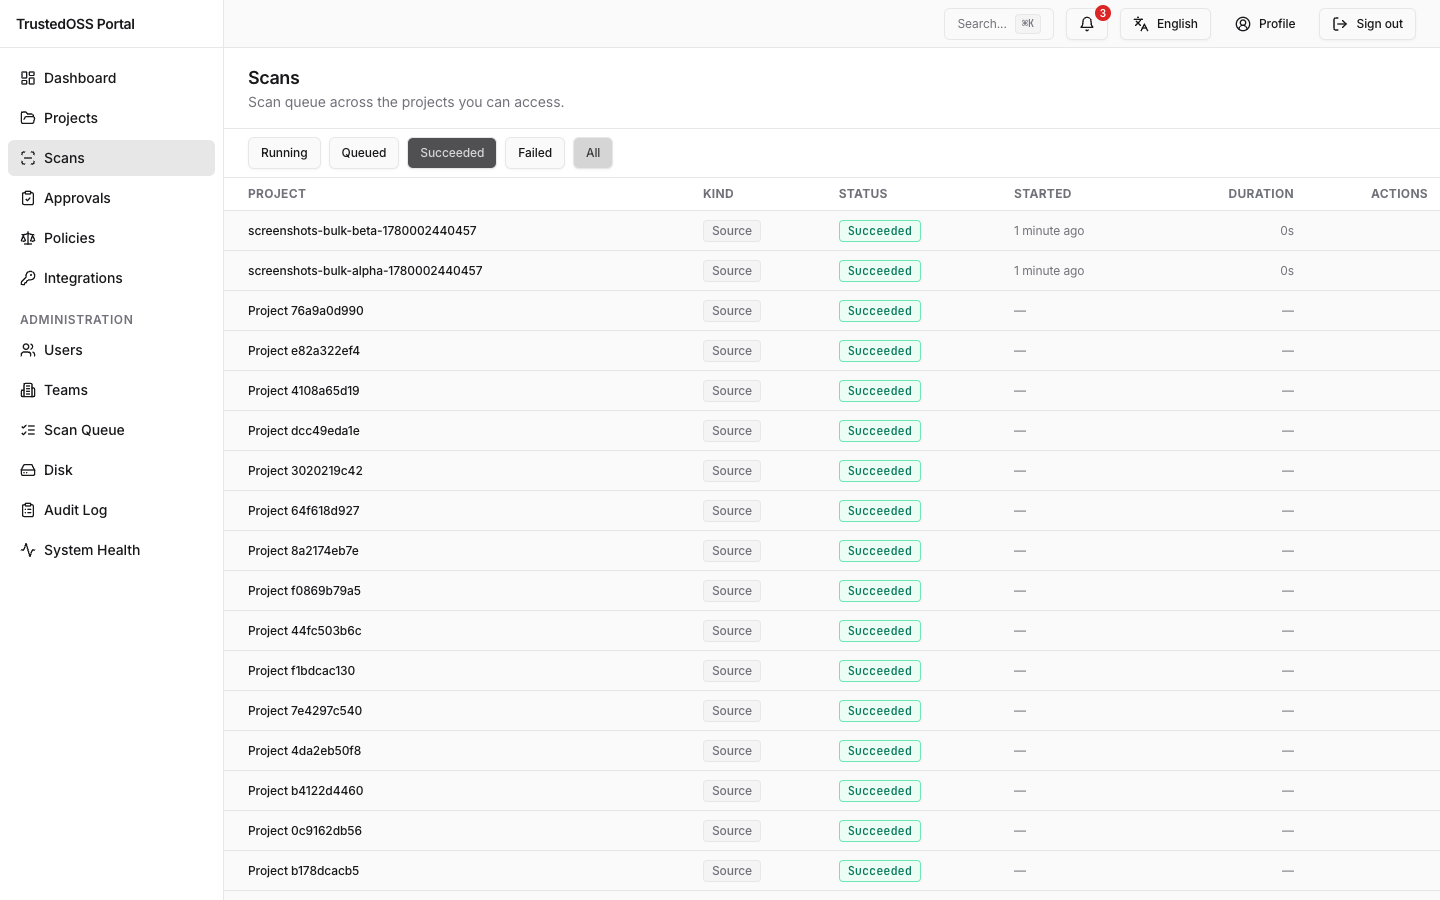
The Project column shows the project's display name and links to its detail page; rows where the underlying project name could not be resolved (a foreign-key fallback path) fall back to the first 8 characters of the project UUID. The list endpoint batch-loads the project relationship in a single round-trip, so the column populates without per-row lookups even on a queue of hundreds of scans.
Each queued or running row carries a Cancel scan action in its Actions column — see Cancel a scan.
Cancel a scan
You can stop a scan that is still queued or running — for example, when you triggered it against the wrong branch, or a large repo is taking longer than expected and you want to free the worker slot.
Any team member with developer or higher on the owning team. You can cancel only your own team's scans; a scan belonging to another team is not visible to you and cannot be cancelled. Super admins can cancel any scan from the admin scan queue.
From the UI
The Cancel scan action appears in two places:
- The scan progress drawer (opens after you trigger a scan, or when you reopen a running scan).
- The Actions column of each
queuedorrunningrow in the global scan queue (/scans).
To cancel:
- Click Cancel scan.
- An inline confirmation appears. Click Cancel scan again to confirm, or Keep running to dismiss.
- The scan moves to
cancelledand the progress bar stops.
What happens on the server when you confirm:
- The worker task is stopped (the Celery task is revoked with
SIGTERM). - The scan's workspace (the cloned source tree) is reclaimed.
- The status becomes
cancelled, with a completion timestamp anderror_message = "cancelled by user". - The action is recorded in the audit log as a
scansupdate.
Cancellation is processed entirely on the server. After you confirm, you can close the panel or the browser tab — the worker stops and the workspace is cleaned up regardless.
A scan that already reached a terminal state (succeeded, failed, or cancelled) cannot be cancelled. The UI shows the message "This scan already finished and can no longer be cancelled." This is expected — there is nothing left to stop.
From the API
curl -sS -X POST \
  "https://trustedoss.example.com/v1/scans/${SCAN_ID}/cancel" \
  -H "Authorization: Bearer ${TRUSTEDOSS_API_KEY}" | jq .
| Response | Meaning |
|---|---|
200 OK | The scan was cancelled. The body carries the updated scan record with status: "cancelled". |
404 Not Found | The scan does not exist, or it belongs to a team you are not a member of. Other teams' scans are existence-hidden — a 404 does not confirm that the scan exists. |
409 Conflict | The scan is already in a terminal state. The RFC 7807 body carries the extension field scan_already_cancelled: true. |
Verify the cancel worked
- The scan status reads Cancelled in the drawer and in the
/scansqueue (Cancelled appears under the All tab). - The progress bar is no longer advancing.
- The worker slot is free — a
queuedscan behind it beginsrunning. - The audit log records a
scansupdateevent with the new status.
Watching scan progress
Once a scan is queued the scan progress drawer opens with three panels stacked top-to-bottom:
- Stage list — every pipeline stage with its current state (
pending,running,succeeded,failed,skipped). The active stage carries a live spinner. - Per-stage log panel — a scrollable text panel mirroring the worker's log frames for the currently selected stage. Click any stage row to switch the panel to that stage's frames; the panel auto-scrolls to the latest frame while you stay near the bottom and pauses auto-scroll when you scroll up to read earlier output. Frames are buffered up to the most recent ~500 lines per stage; older lines roll off.
- Action footer — Cancel scan while the run is non-terminal; close affordance once it reaches
succeeded/failed/cancelled.
Re-opening the drawer for an already-completed scan replays the persisted stage transitions and final log frame from the database (the spinner does not keep spinning on a succeeded row — the stage's terminal state is shown). Live frames stream over the WebSocket below.
WebSocket progress feed
The UI subscribes to ws(s)://<host>/ws/scans/{scan_id} for live stage and percentage updates. The connection auto-reconnects with exponential backoff if the network drops. Reconnect re-emits the latest stage so the UI converges quickly.
If you build a custom client, the message shape is:
{
  "step": "trivy",
  "percent": 90,
  "ts": "2026-05-09T13:42:11Z"
}
percent is an integer 0–100. step is one of the pipeline slugs (bootstrap, fetch, prep, cdxgen, sign, scancode, approvals, scanoss, trivy, finalize) plus the two terminal states (succeeded, failed). The scancode slug replaced the former ort slug, and trivy replaced the former dt_upload/dt_findings pair after the Dependency-Track removal (ADR-0001). The frame does not echo scan_id — the subscriber already knows it from the URL.
Verify it worked
After a scan completes:
- The project status switches to Succeeded.
- The Components count > 0.
- The Vulnerabilities count is visible (may be 0 if the project is genuinely clean).
-
The Last scan timestamp on the Overview tab reflects "now".
SELECT count(*) FROM scans sJOIN projects p ON p.id = s.project_idWHERE p.slug = 'portal-web'AND s.status = 'succeeded'AND s.completed_at IS NOT NULL;
- The audit log records
target_table=scans&action=createandtarget_table=scans&action=updateevents.
Troubleshooting
The commands below target the production compose (docker-compose.yml),
whose Celery services are worker and beat. On the dev compose
(docker-compose.dev.yml) the same services are celery-worker and
celery-beat — substitute the name and the -f file if you are on the dev
stack.
Scan stuck in Queued
No worker has picked it up. Either the worker is down or the queue is saturated.
docker-compose -f docker-compose.yml ps worker
docker-compose -f docker-compose.yml logs --tail=200 worker
If the worker is unhealthy, restart it:
docker-compose -f docker-compose.yml restart worker
If the queue is saturated, increase CELERY_CONCURRENCY in .env and docker-compose up -d worker to scale up. Each concurrent slot needs ~2 GB of RAM.
Scan failed with git clone error
The worker could not reach the repository. Check:
- Is the repo URL correct? (Test from the worker:
docker-compose exec worker git ls-remote <url>.) - Is the repo private? Embed credentials in the
git_url— see Projects → Private repositories. - Does the worker have outbound HTTPS to your Git host? Corporate proxies must be set in
.env(HTTP_PROXY,HTTPS_PROXY).
Scan finished but vulnerabilities are missing
The local Trivy DB may not be in place yet. Confirm on the worker:
docker-compose -f docker-compose.yml exec worker \
  ls -lh /var/lib/trivy/db/
An empty or absent db/ directory means the boot-time download has not completed. The first download takes 1–3 minutes; the automatic re-match beat repopulates findings on existing scans once the DB lands — no re-scan needed. See Vulnerability data — Troubleshooting.
Scan stuck running for ≥ 4 hours
First try Cancel scan from the drawer or the /scans queue (see Cancel a scan). If the run does not move to cancelled — for example because the broker is unreachable — use the on-call playbook for force-cancel + worker inspect:
On-call runbook → Scan stuck.
"Cancel scan" does nothing / the scan stays running
The cancel request reached the API but the worker did not stop in time:
- If the broker (Redis) was briefly unreachable, the scan is still marked
cancelledand the workspace is reclaimed by the orphan-workspace cleaner and the worker hard-limit backstop — you do not need to retry. - If the row still shows
runningafter a minute, confirm the worker is up (docker-compose -f docker-compose.yml ps worker) and escalate via the on-call runbook.
"This scan already finished and can no longer be cancelled"
The scan reached a terminal state (succeeded / failed / cancelled) between the moment the page loaded and the moment you clicked Cancel scan. Reload the queue to see the up-to-date status — no action is needed.
A second scan won't start — the Scan button is greyed out
The project already has a queued or running scan. Only one active scan per project is allowed. Open the in-progress chip in the project header (or the row in the global queue) to see the existing run, wait for it to finish, or Cancel it before starting another. See Only one scan at a time per project.
A completed scan's drawer shows a spinner that never finishes
Older builds (pre-P1) left the Finalizing step's spinner animating after the scan had already reached succeeded. The fix freezes the spinner on the terminal state when the drawer is opened on a completed run. If you still see the symptom, force-reload the project page to refresh the cached scan record.
Detected (first-party) licenses are missing
The Detected licenses come from scancode and are best-effort. They may be absent when:
- scancode is not installed in the worker image (the scan still succeeds with declared licenses only — non-fatal). Confirm with
docker-compose -f docker-compose.yml logs worker | grep scancode_stage_skipped. - The first-party tree exceeds the
SCANCODE_MAX_FILESceiling, scancode timed out, or the result was too large — all log a warning and fall back to declared-only. - The relevant code lives inside an excluded directory (
node_modules,vendor,.git,dist,build,out,target,.venv, …). Those are skipped by design — see Components & licenses → Detected vs. declared.
Roadmap
Items tracked for later releases.
- Branch-override field on the project-level Scan trigger — planned. (The Source / Container kind-selection dialog shipped in this release — see Trigger a scan → From the UI.)